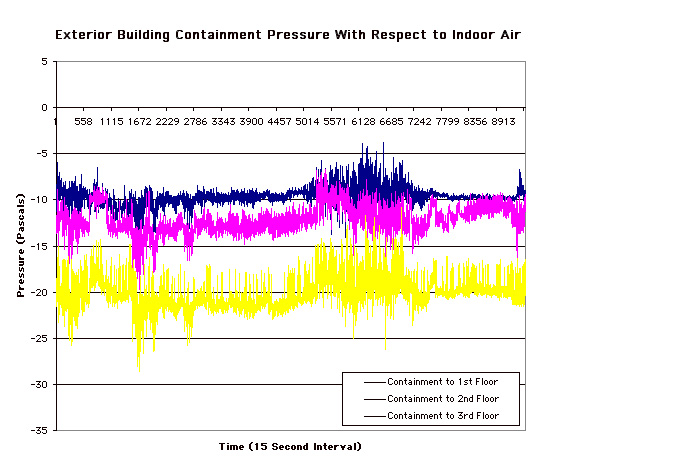
Chart from a typical three port pressure log during mitigation activities in the exterior containment. The three colored lines depict the pressure in the containment with respect to one area on each of the three floor of the building. The short term variation in the readings may be a result of individual or combined factors such as chatter from the logging instrument, wind loads on the exterior containment, mitigation activities within the containment and variations in the building ventilation system operation.